

This website uses cookies to improve your experience. If you continue to use this site, you agree with it. Privacy Policy
  • Solutions
    • Accounts
      • Personal & Joint Investing
      • Rollovers and Transfers
      • Retirement Investing
      • Children & Education
      • Business Investing
      • Nonprofit Organizations
      • Charitable Giving
    • Service
      • Access Service
      • Express Service
  • About
    • Our Story
    • Our Values
    • Our Team
    • Sharia Compliance
    • Contact
  • Resources
    • Stock Screener
    • Webinars
    • Blog
  • Login
  • Get Started
  • info@shariaportfolio.com
    (321) 275-5125
    1331 South International Parkway
    (Suite 2291) | Lake Mary, FL 32746
Get Started

Is AI in a Bubble?

Aliredha WaljiBy Aliredha Walji
October 28, 2026
A man with grey hair, round glasses and a grey beard, in a navy shirt, concentrating on a laptop screen.

The general concern amongst many people I have been talking to has been: Is AI in a Bubble? It is a fair question and certainly one that seems to dominate bearish headlines often. I wanted to take an opportunity to share my overall assessment, the risks I am considering, and the data that contributes to my analysis.

Our first step should be to define what a bubble is. A bubble forms when an asset rises significantly above its intrinsic value. This is often driven by speculation or overly optimistic behavior. It is then followed by a sharp decline, often referred to as a bubble popping. This is not a new phenomenon, if you have some spare time, it may be worth reading about Tulip Mania in the 1630s.

Probably a more relevant example of a bubble is the dot-com bubble at the turn of the century (European Central Bank, 2026). This is the crisis that people tend to compare the AI environment to. Some of the charts being shared make the case for concern. The one below compares the Nasdaq, which shows to be heavy in growth and technology companies, with the Dow, which includes established blue-chip companies. As shown, the ratio reached 0.49 last year, above the 0.46 level reached at the height of the dot-com era in 2000 (Opening Bell Daily, 2025).

Nasdaq-to-Dow ratio, 1980 to end October 27th 2025
Figure 1. Nasdaq-to-Dow ratio, 1980 to end October 27th 2025. Source: Opening Bell Daily.

That being said, a ratio like this is a blunt tool and requires context. The Dow is a price-weighted index of only 30 companies, and the Nasdaq today looks very different from the Nasdaq of 2000. The chart illustrates that the market has tilted heavily toward growth. It cannot tell us on its own whether prices are justified. That is why the situation should be evaluated from a variety of factors and sources.

1. Valuations: bubbles tend to form when prices outrun earnings

One of the defining features of a bubble is a valuation that stretches far beyond what earnings can support. At the top of the dot-com bubble, forward price-to-earnings (P/E) ratios on leading technology names reached extraordinary levels: Cisco at 130.3x, Oracle at 120.4x, Microsoft at 60.2x, and Intel at 47.3x (FactSet, 2025). In comparison, we are seeing P/E ratios for Micron at 13.87x, Google at 17.75x, and Nvidia at 28.89x (Morningstar, 2026).
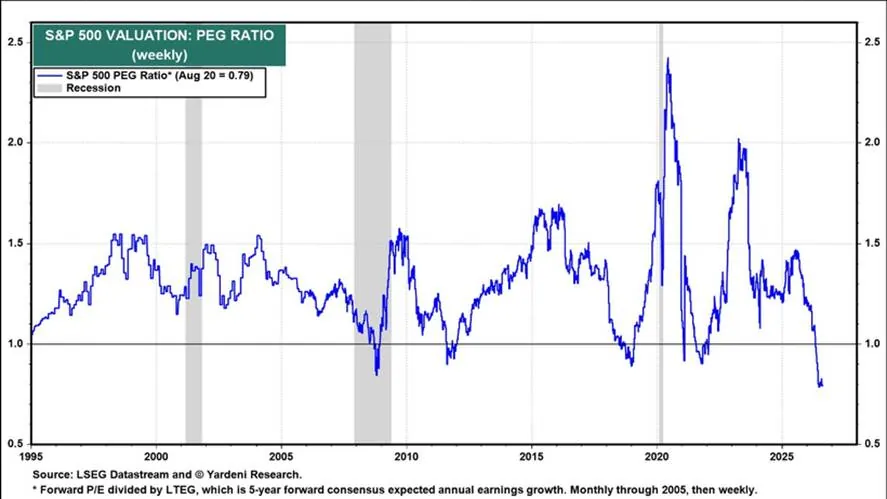
PEG Ratio of S&P 500 companies from 1995-2026
Figure 2. PEG Ratio of S&P 500 companies from 1995-2026. Source. LSEG Datastream and Yardeni Research

Today we are seeing strong earnings that many use to justify the valuations of these large AI names. As seen in the graph above, I believe our current landscape is very different from the Dot-com Bubble. The rapid growth of many stocks may be comparable, but we must examine what is fueling this escalation.

2. Monetization: bubbles burst when technology fails to make money

Historically, bubbles tend to pop when a new technology cannot turn its promise into revenue, and the money already spent can no longer be justified (Paul Krugman, 2025). So far, AI has shown the opposite pattern, with revenue and profit rising at many of the companies at the core of AI expansion.
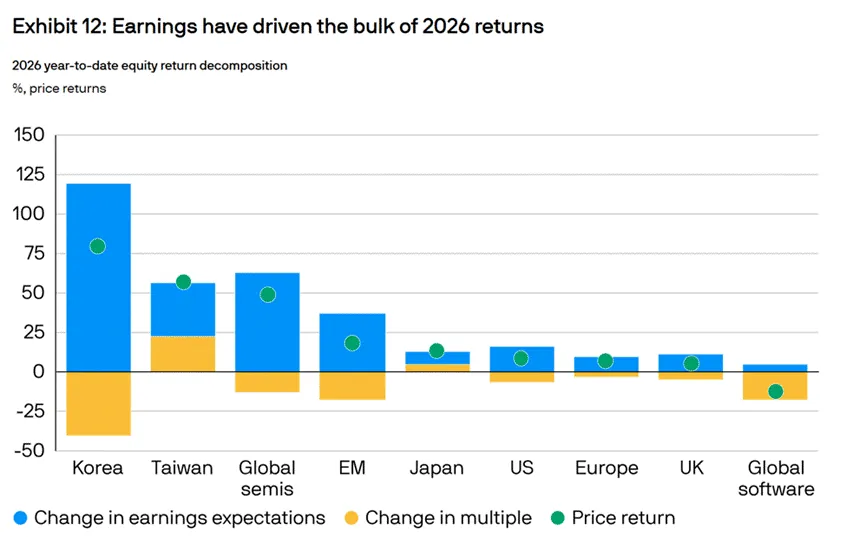
Earnings have driven the bulk of 2026 returns: 2026 year-to-date equity return decomposition, price returns
Figure 3. Earnings have driven the bulk of 2026 returns: 2026 year-to-date equity return decomposition, price returns. Source. @MelvinInvests via X

3. Concentration: The S&P 500 falls flat without Big Tech

Investors saw the relatively large contribution to gains by Big Tech in 2023 and 2024 (Morningstar, 2025). While the specific contributors to the gains have shifted a little, the narrative is still consistent, much of the market’s return has come from a small group of companies.

As shown below, the pattern of a few stocks delivering a large portion of growth has continued in 2026. The S&P 500 is up about 14% this year, (YahooFinance, Oct 13th 2026). Excluding AI-related companies, the rest of the index is up only in the mid-single digits, while the AI Winners index is up roughly 55% to 60%.
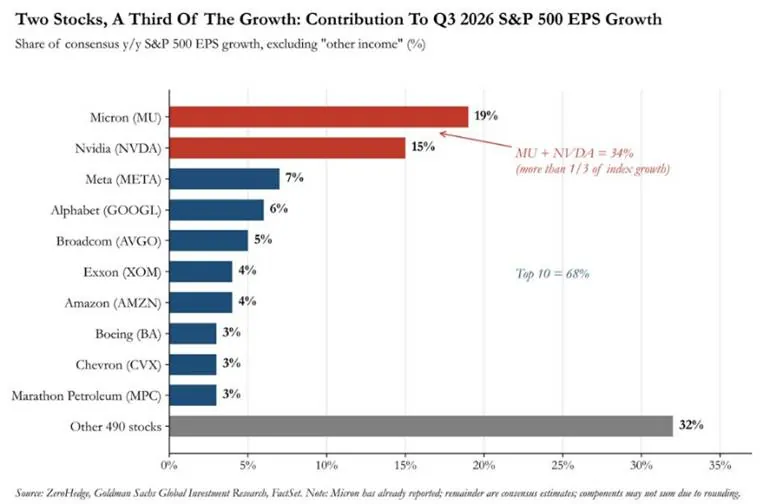
Contribution to EPS growth
Figure 4. Contribution to EPS growth. Source. ZeroHedge, Goldman Sachs, FactSet

Examining Figures 4 and 5, we can see that a large portion of the market’s gain can come from one theme. Concentration is a double-edged sword. It has rewarded investors who owned these companies, but when so much of an index’s return depends on a small group of stocks, a setback in that group weighs heavily on the whole market and on portfolios that track it.
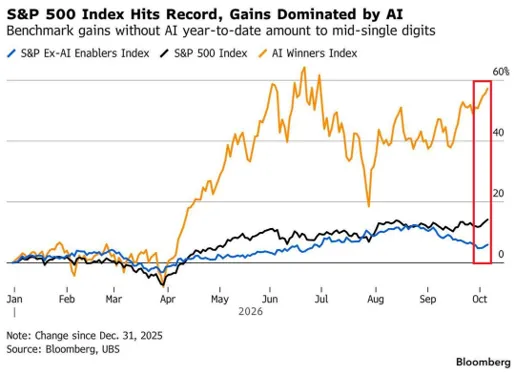
From December 31, 2025 to October 2026: S&P Ex-AI Enablers Index, S&P 500 Index and AI Winners Index
Figure 5. From December 31, 2025 to October 2026: S&P Ex-AI Enablers Index, S&P 500 Index and AI Winners Index. Source: Bloomberg, UBS

4. CAPEX

Perhaps, the most debated part of the AI story could be the amount of money going into infrastructure. I think that demand for AI computing power could rise dramatically as AI capacity and utility expands. Goldman Sachs Research estimates that monthly token use by agentic AI applications could multiply about 24 times by 2030.
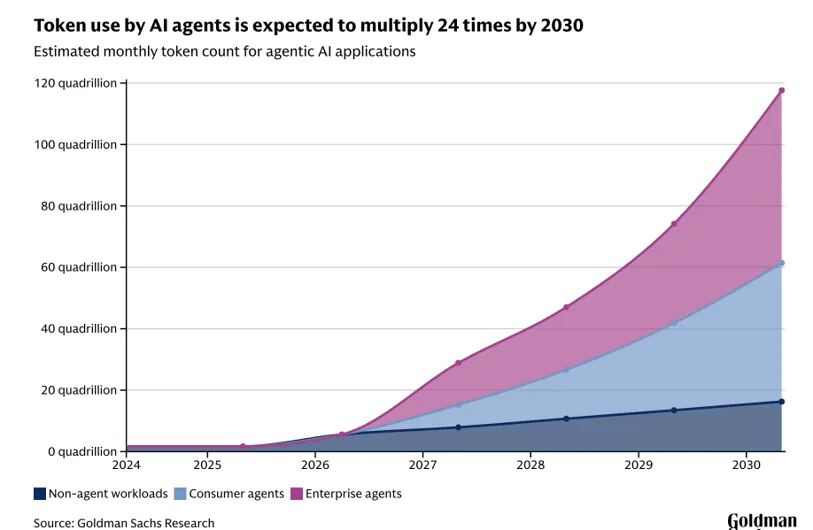
Estimated monthly token count for agentic AI applications, 2024 to 2030 (projection)
Figure 6. Estimated monthly token count for agentic AI applications, 2024 to 2030 (projection). Source: Goldman Sachs Research.

AI spending is far above other innovations as a percentage of GDP. This statistic can be taken in two different ways. It could be construed as businesses having high faith in the productivity and potential of AI, so they are spending to take advantage of the boom. It can also be construed negatively as a closed loop where revenues may be inflated due to overspending. One company’s spending can be seen as another’s revenue, but if the returns on these investments disappoint, spending could be cut and the effect would run in reverse. That is the central risk to this story, but one that I think has the potential to pay off greatly.

Average annual infrastructure spending as a percentage of GDP
Figure 7. Average annual infrastructure spending as a percentage of GDP. AI spending is estimated. Source: Stijn van Nieuwerburgh, via Charlie Bilello on X

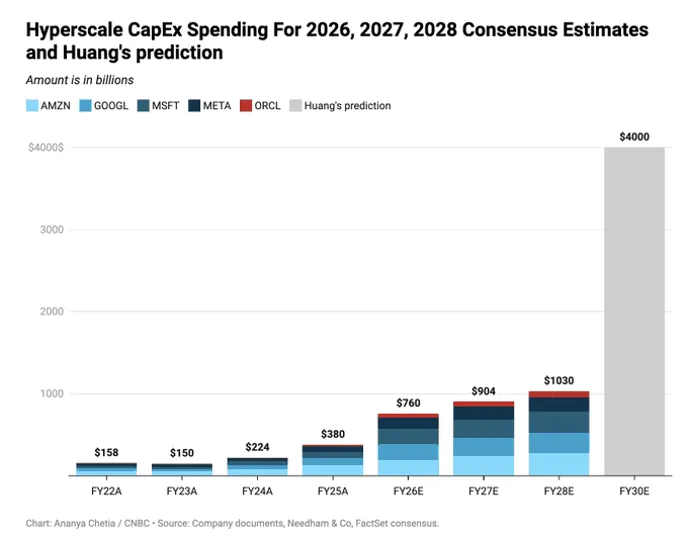
Spending is accelerating quickly amongst the big players. Capital expenditure by large hyperscalers is expected to jump from $412 billion in 2025 to $789 billion in 2026, an increase of about 92% in a single year, and estimates reach nearly $1.2 trillion per year by 2029 according to data from FactSet.
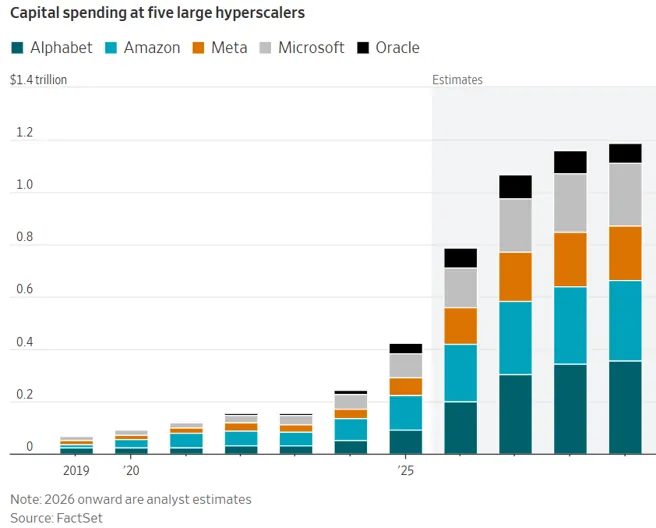
Capital spending at five large hyperscalers (Alphabet, Amazon, Meta, Microsoft, Oracle)
Figure 8. Capital spending at five large hyperscalers (Alphabet, Amazon, Meta, Microsoft, Oracle). 2026 onward are analyst estimates. Source: FactSet.
Hyperscale capex consensus estimates for 2026 to 2028 and Huang’s prediction, in $ billions
Figure 9. Hyperscale capex consensus estimates for 2026 to 2028 and Huang’s prediction, in $ billions. Chart: Ananya Chetia/CNBC. Source: company documents, Needham & Co., FactSet consensus.

5. Interest rates: the Fed is keeping rates elevated. Should we be concerned?

As shown in the chart, the S&P 500 has been less sensitive to the level of interest rates than many investors might assume. Since 1954, the S&P 500’s average forward returns have been positive across every interest-rate environment shown below. For example, when the effective Fed funds rate was above 6.85%, the S&P 500’s average return over the following year was 14.7%. When it was between 0% and 1.34%, it was 16.5% (Creative Planning, 2026).

Fed funds rate and S&P 500 average forward total returns, 1954 to 2026
Figure 10. Fed funds rate and S&P 500 average forward total returns, 1954 to 2026. Real rate = Fed funds minus year-over-year CPI. Data via YCharts. Chart: Charlie Bilello, Creative Planning.

So, are we in a bubble?

Based on the facts currently available, no definitive conclusion can be reached as to whether it is or isn’t. However, based on the analysis that I have done; I believe that the AI buildout still has strong potential to grow. Spending does not appear to be slowing down, earnings have been strong, and my thesis that winners take most has been largely correct over the last few years. There will always be risks and we are continually examining and mitigating them. However, portfolios are designed to achieve long-term objectives, and investment theses often require time to develop and be reflected in results. If you have any questions or concerns, please don’t hesitate to reach out to your advisor.

Disclaimer:

This material is provided for informational purposes only and does not constitute an offer to sell or a solicitation of an offer to buy any securities or investment advisory services. Nothing contained herein should be construed as personalized investment, legal, or tax advice. Any opinions expressed are as of the date of publication, are subject to change without notice, and may not reflect the views of the firm as a whole. The information contained herein is believed to be reliable but is not guaranteed as to accuracy or completeness. Past performance is not indicative of future results. All investments involve risk, including the possible loss of principal. Any forward-looking statements or projections are based on current assumptions and are subject to change and may not materialize. Advisory services are offered only to clients or prospective clients where the firm and its representatives are properly licensed or exempt from registration. Before making any investment decision, readers should consult with their financial, legal, and tax advisors and review all applicable disclosure documents, including the firm’s Form ADV. ShariaPortfolio, Inc. is registered as an investment adviser with the U.S. Securities and Exchange Commission. Registration does not imply a certain level of skill or training. Additional information about ShariaPortfolio, Inc. is available in its Disclosure Brochure, Part 2A of Form ADV, which is available upon request or at www.adviserinfo.sec.gov.

Aliredha Walji
About the author
Aliredha Walji
CEO | Portfolio Manager

Aliredha Walji joined ShariaPortfolio in 2014 and currently oversees the company’s US wealth management business as CEO. He also serves as Chief Compliance Officer and Portfolio Manager for the company’s growth strategies.

A pre-med student who transitioned to the world of business, Aliredha completed his bachelor’s degree from the University of Minnesota and his MBA from Crown College, a faith-based institution. With a deep connection to his faith and a desire to make a positive impact, he found meaningful work at the intersection of finance and values.

Aliredha has been featured in both Forbes and US News and World Report, and has served as the US Correspondent for Islamic Finance News. He lives in Longwood, FL with his wife and six children. In his spare time, he enjoys cooking, volunteering, and jogging.

LinkedIn
Previous Post
Conducting an Effective Halal Year-End Wealth Evaluation
Join our newsletter for insights, webinars and updates
  • Should be Empty:

Navigate

  • Mobile Nav – Top
  • Solutions
    • Accounts
      • Personal & Joint Investing
      • Rollovers and Transfers
      • Retirement Investing
      • Children & Education
      • Business Investing
      • Nonprofit Organizations
      • Charitable Giving
    • Service
      • Access Service
      • Express Service
  • About
    • Our Story
    • Our Values
    • Our Team
    • Sharia Compliance
    • Contact
  • Resources
    • Stock Screener
    • Webinars
    • Blog
  • Login
  • Get Started
  • Contact Info

Solutions

  • Investment Solutions
  • Personal & Joint Investing
  • Rollovers and Transfers
  • Retirement Investing
  • Children & Education
  • Business Investing
  • Nonprofit Organizations
  • Charitable Giving

About

  • About
  • Sharia Compliance
  • Our Team
  • Service Pathways
  • Contact

Resources

  • Stock Screener
  • Webinars
  • Insights

Connect

info@shariaportfolio.com
(321) 275-5125
1331 South International Parkway
(Suite 2291) | Lake Mary, FL 32746

ShariaPortfolio, Inc. is an investment adviser registered with the U.S. Securities and Exchange Commission and notice filed with state regulatory agencies that have limited regulatory jurisdiction over our advisory business practices. ShariaPortfolio provides advisory services only in jurisdictions where it is properly registered, notice filed, or exempt from registration. No new accounts will be accepted unless and until all applicable local regulations are satisfied. The information on this website is for informational and educational purposes only and is not intended as personalized investment advice, a recommendation, or an offer or solicitation to buy or sell any security or to provide advisory services in any jurisdiction where such offer or solicitation would be unlawful. All investments involve risk, including possible loss of principal. There is no guarantee that any investment strategy will achieve its objectives. Past performance does not guarantee future results. Diversification and asset allocation do not ensure a profit or protect against loss. Any references to tax or legal matters are for informational purposes only and should not be relied upon as tax or legal advice. Consult your own tax, legal, and other professional advisers regarding your individual circumstances. References to “Sharia-compliant,” “Halal,” or similar terms reflect ShariaPortfolio’s internal criteria and understanding of Islamic investment principles. Interpretations of Sharia may differ, and there is no guarantee our approach will be accepted by all scholars or investors. Please review ShariaPortfolio’s Form ADV and other disclosure documents carefully before engaging our services. If you are interested in our services, please contact us and request a copy of our Disclosure Brochure (Form ADV Part 2A), which provides detailed information about ShariaPortfolio, Inc., our services, and risks.

ShariaPortfolio, Inc. is an investment adviser registered with the U.S. Securities and Exchange Commission. Registration does not imply a certain level of skill or training. This material is for informational purposes only and does not constitute personalized investment, legal, tax, or religious advice. Investing involves risk, including possible loss of principal and there is no guarantee that any investment strategy will achieve its objectives. Past performance does not guarantee future results. ShariaPortfolio’s halal investment strategies use the firm’s stated screening methodology, which draws from selected AAOIFI principles and applies the firm’s stated business-activity and financial-ratio criteria. Sharia standards and interpretations may differ among scholars and organizations. Screening may restrict available investments and affect diversification and performance. Incidental interest or other non-compliant income may arise. ShariaPortfolio, Inc. may provide general information, guidance, and calculations concerning purification and zakat solely for educational and informational purposes. ShariaPortfolio does not assume responsibility for determining, calculating, or making any zakat, purification, or charitable distributions. Each investor is solely responsible for determining and satisfying any such obligations. For additional information about ShariaPortfolio’s services, fees, investment methods, and risks, please review its Form ADV Part 2A brochure, available at https://shariaportfolio.com or upon request via email info@shariaportfolio.com.

View our Form CRS   Request Form ADV Part 2A Disclosure Brochure

© Copyright 2026. All rights reserved, ShariaPortfolio, Inc.

Disclaimers   Privacy Policy   Site Map

Scan to view this page online
shariaportfolio.com/is-ai-in-a-bubble/