Do presidential elections affect the stock market? Every four years there is a convergence between US politics and investments. Since the beginning of exchange traded securities, there has been a continuous debate about the correlation of politics and market performance. This debate ultimately percolated into “Presidential Election Theory1”, which suggests that the markets perform best during the third year of a sitting president. Other portions of the debate pertain to the difference between Republican and Democratic presidents and whether or not the presidential candidates includes a sitting president up for re-election.
There are many ideas and patterns that have been noted regarding the effect of elections on your portfolio and investments. Analysis of historical stock performance shows that there is some correlation between years of presidential cycle and the stock market return. As per the Stock Traders Almanac2, on average, bear markets, recessions, and wars start in the first two years of a president, whereas bull markets and prosperous times begin in the last two years.
Let’s see how certain factors surrounding presidential elections have historically affected the stock market:
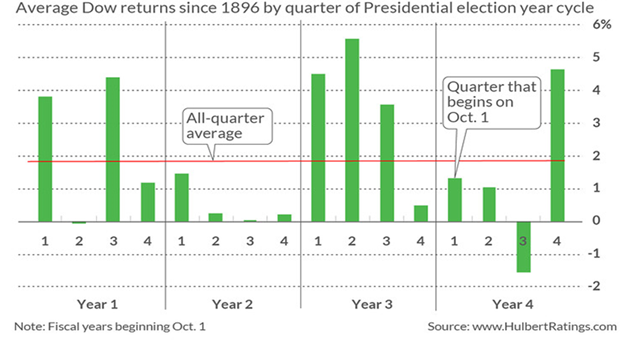
Years of a Presidential Cycle: The Dow Jones Index3 has averaged a return of 2.4% in the first year of a president, 4.2% in the second year, 10.4% in the second last year, and 6% in the election year. However, it has not always run like clockwork; in 2008, an election year, the Dow Jones collapsed by 34%. And in the last presidential cycle, the Dow gained 27% in the first year of Obama’s second term and 7.5% in the second year, while falling by 2% in the third year, which was supposed to be the strongest year according to the 182 year-long average. On a quarterly basis, the third quarter of the last year of a presidential cycle is generally negative, while the fourth quarter is positive.
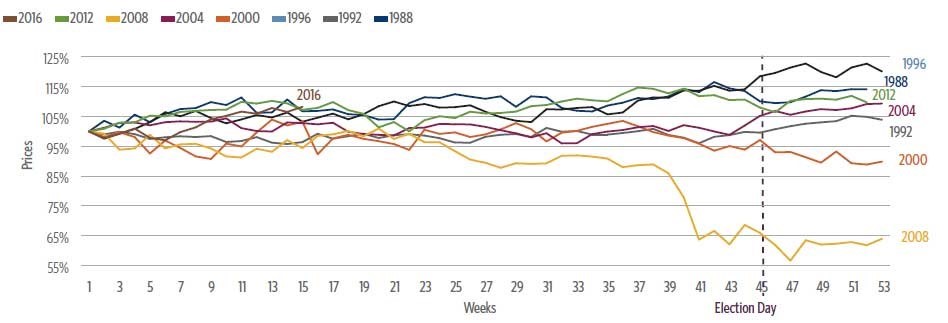
Large vs. Small Cap Stocks: Large cap stocks tend to do better on average after election. In an election year, the performance for large capitalization stocks in general is more mixed. The chart below shows the Dow Jones Industrial Average Index’s weekly performance over the last eight elections:
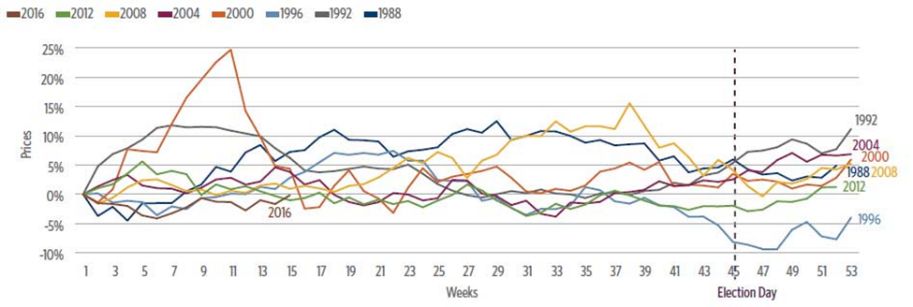
On the other hand, small cap stocks (Russel 2000) have done worse compared to their large cap peers in the run up to elections but tend to bounce back strong after elections because of their higher beta.
Republican vs Democrat: Although conventional wisdom may suggest that a Republican win in the presidential election should be more supportive to business and hence the stock market, this has not always been the case. Since 1990, a Democratic win has been slightly better for the stock market at 9% annualized, compared with an average of 6% annualized during Republican presidencies. Therefore, which party wins the election does not seem to have any tangible effect on the stock market.
Congress vs President: Another enduring legend is that stocks do better in a divided government whereby Congress is dominated by one party and the presidency is taken by the other. The rationale is that this division creates a balance, and the market likes stability. However, this myth has also been debunked. Analysis of data going back to 1928 shows that the S&P 500 has gained 17% annualized during the four years when the same party controlled Congress and the presidency, while averaging 15.6%, when Congress and the presidency were headed by different parties.
Every presidential election is unique to say the least, and with the COVID-19 pandemic hurting social cohesion as well as the economic well-being of the country, this election year is shaping up to be like no other. Markets have been volatile thus far in 2020, and we may enter the seasonally weak period for equities in summer, after recovering from pandemic induced swoon. It is unsure at this point that both parties will be able to go ahead with their nomination conventions in late July. The table is loaded for a lot of volatility for markets. However, by November we may see a reduction in pandemic and the election related uncertainty premium, boding well for the markets in the fourth quarter of the current year.
While election results may not be a great predictor for market returns, the inverse may actually be true. It turns out that the stock market has a strong forecasting capability on who will win presidential elections. If the stock market stays strong and is positive in the three-month run up to the elections, the incumbent tends to win the election. If the stock market return is negative in the three months prior to the elections, the challenger may win the elections. Since 1928, the incumbent (party/president) won the presidential election 12 out of 14 times when the stock market return was positive in the preceding three months, and lost the election seven out of eight times in the same time frame when returns were negative.
Which party ends up winning the presidency could, however, have broad market sector implications. Based on party policy, here is how we foresee sector performance playing out:
- In a Trump re-election: Positive for consumer discretionary, energy, industrials, information technology (IT), and materials; Negative for consumer staples and healthcare; and Neutral for financial services and utilities.
- In a Biden election: Positive for industrials, IT, materials, and utilities; Negative for consumer discretionary, energy, and telecom services; and Neutral for consumer staples, and financials.
- In both scenarios: Positive for healthcare, industrials, IT, and materials.
The problem with investing based on empirical patterns is that it is not an advisable way to make investment decisions. It sounds exciting, and it fulfills a belief that many people have that there’s a way to beat the market. However, there are a lot of external factors which may affect market performance. It may be safer to invest in a more boring but systematic way, based on understanding the risk and return of investing and how it correlates to your situation and objectives.